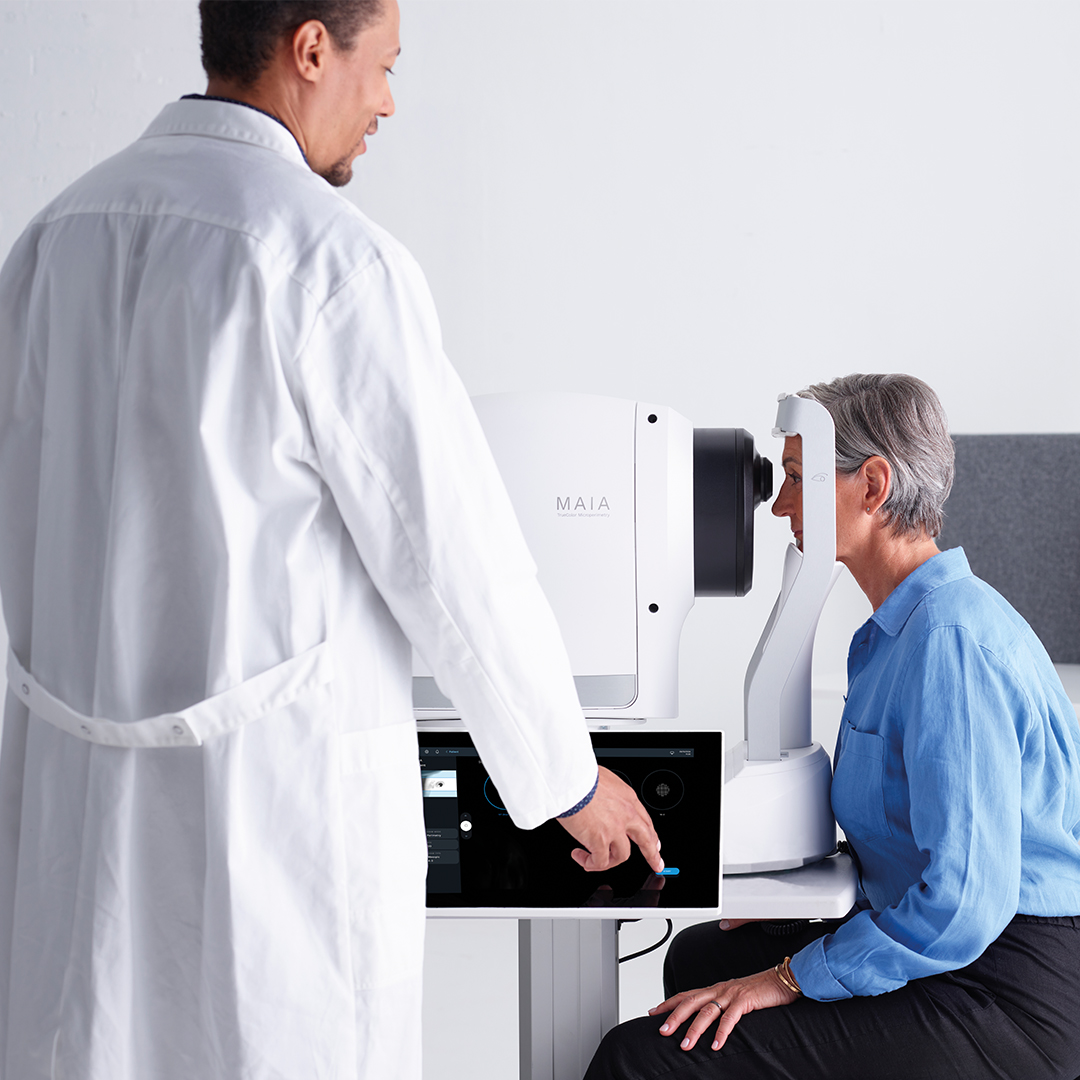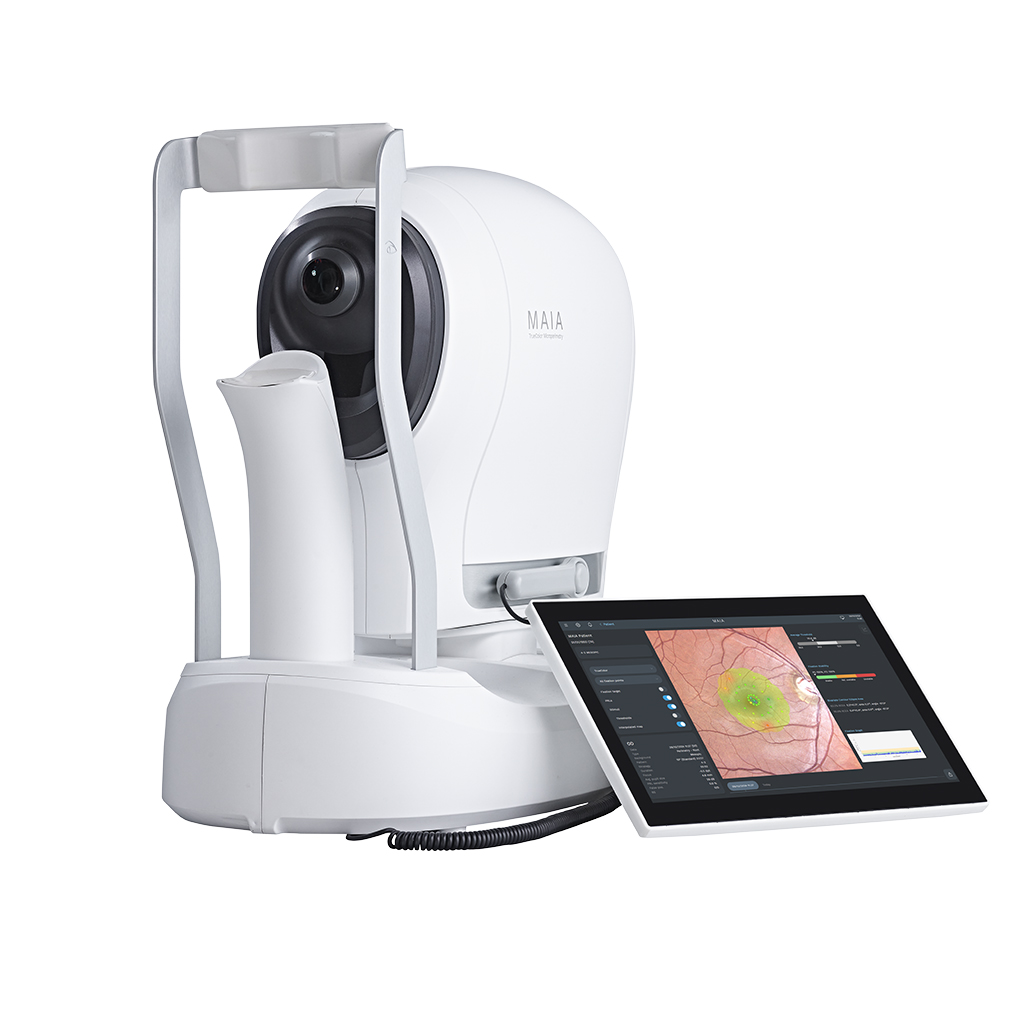
iCare MAIA TrueColor Microperimetry
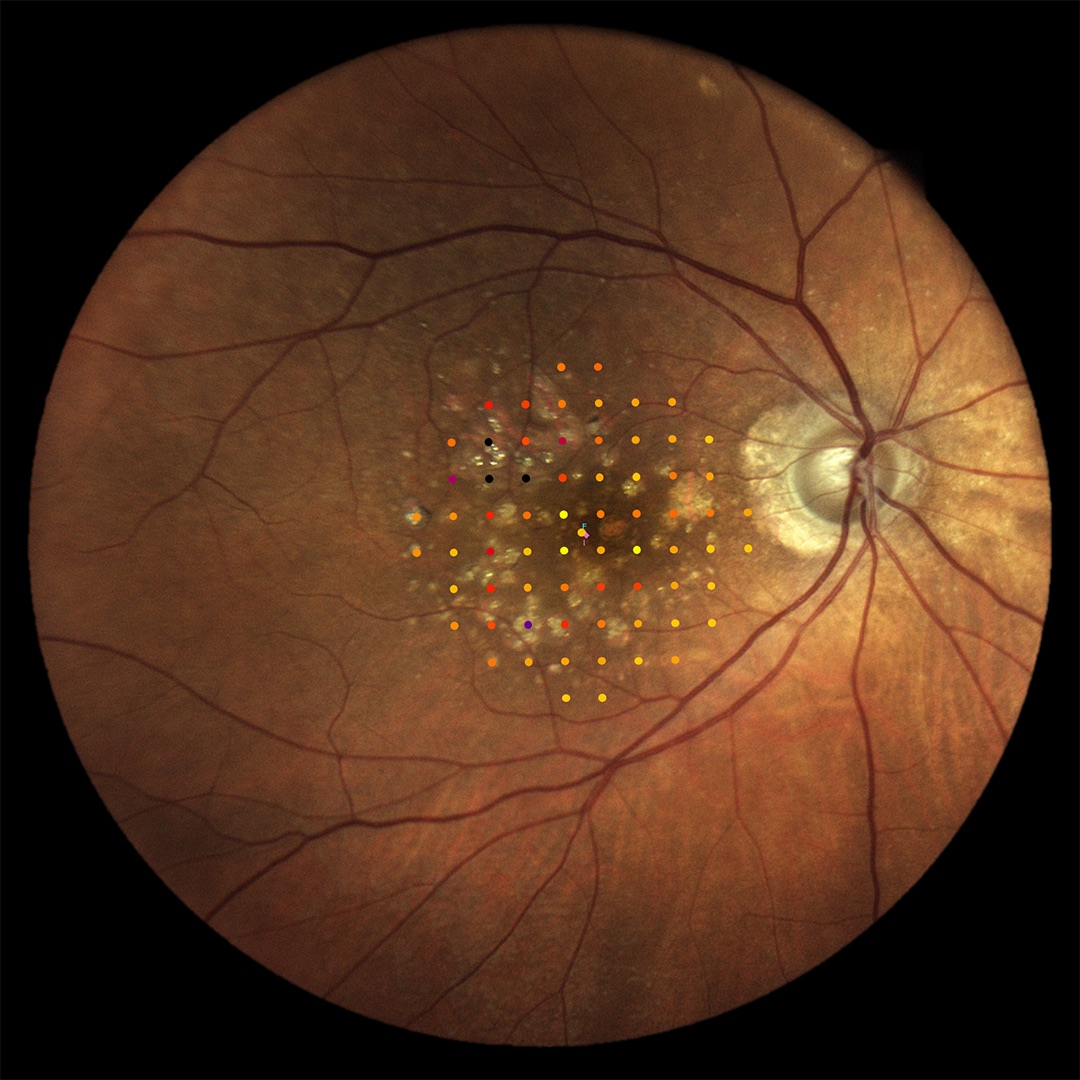
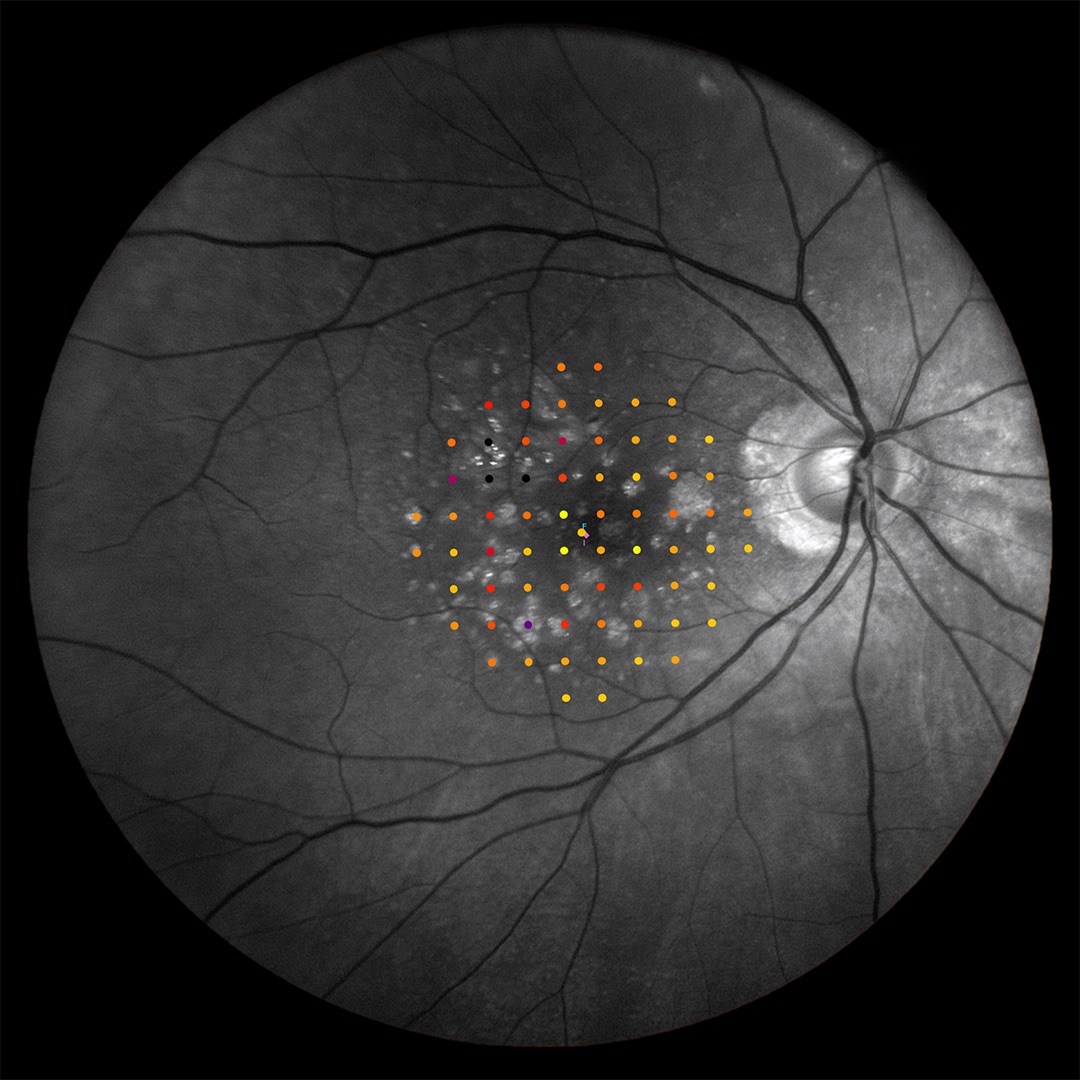
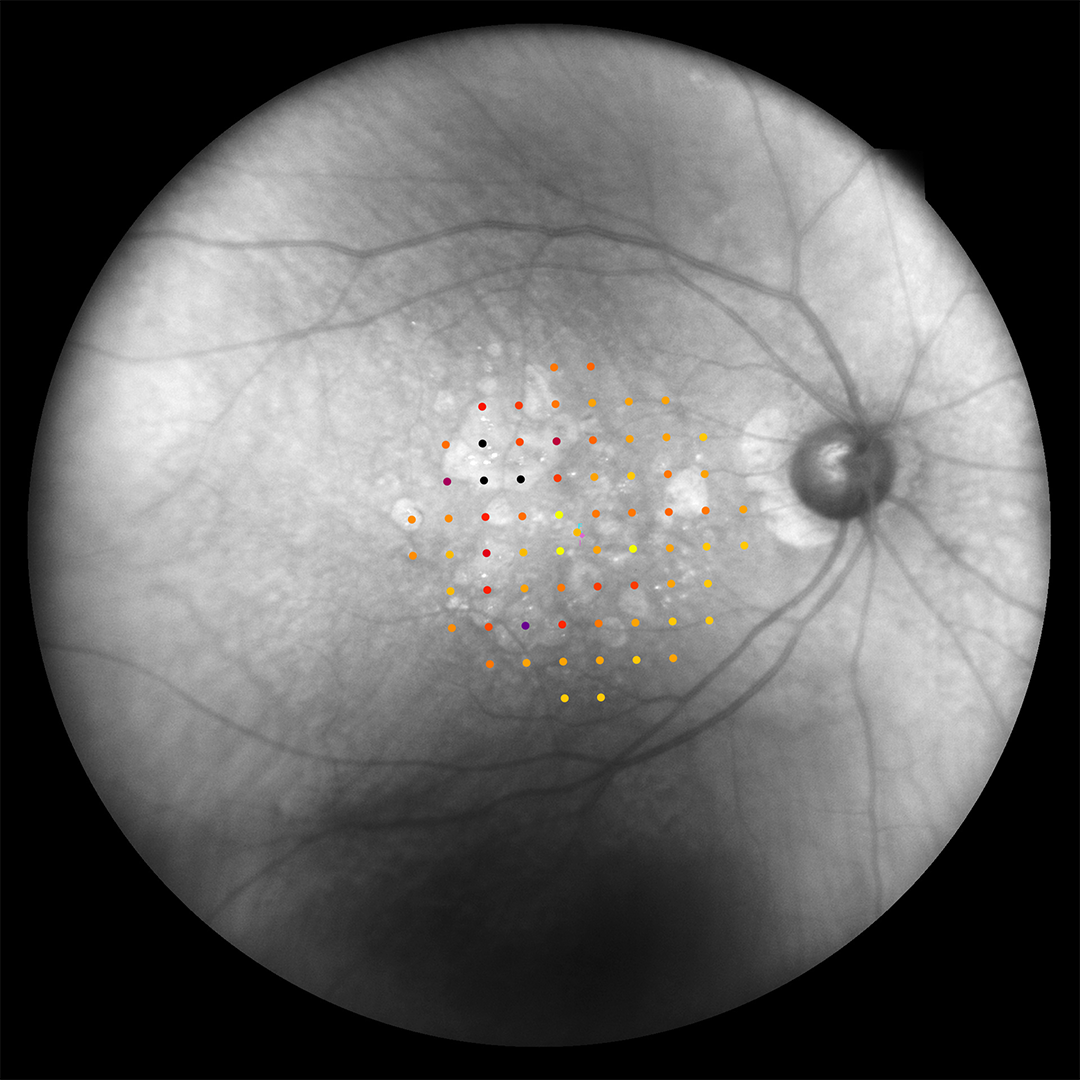
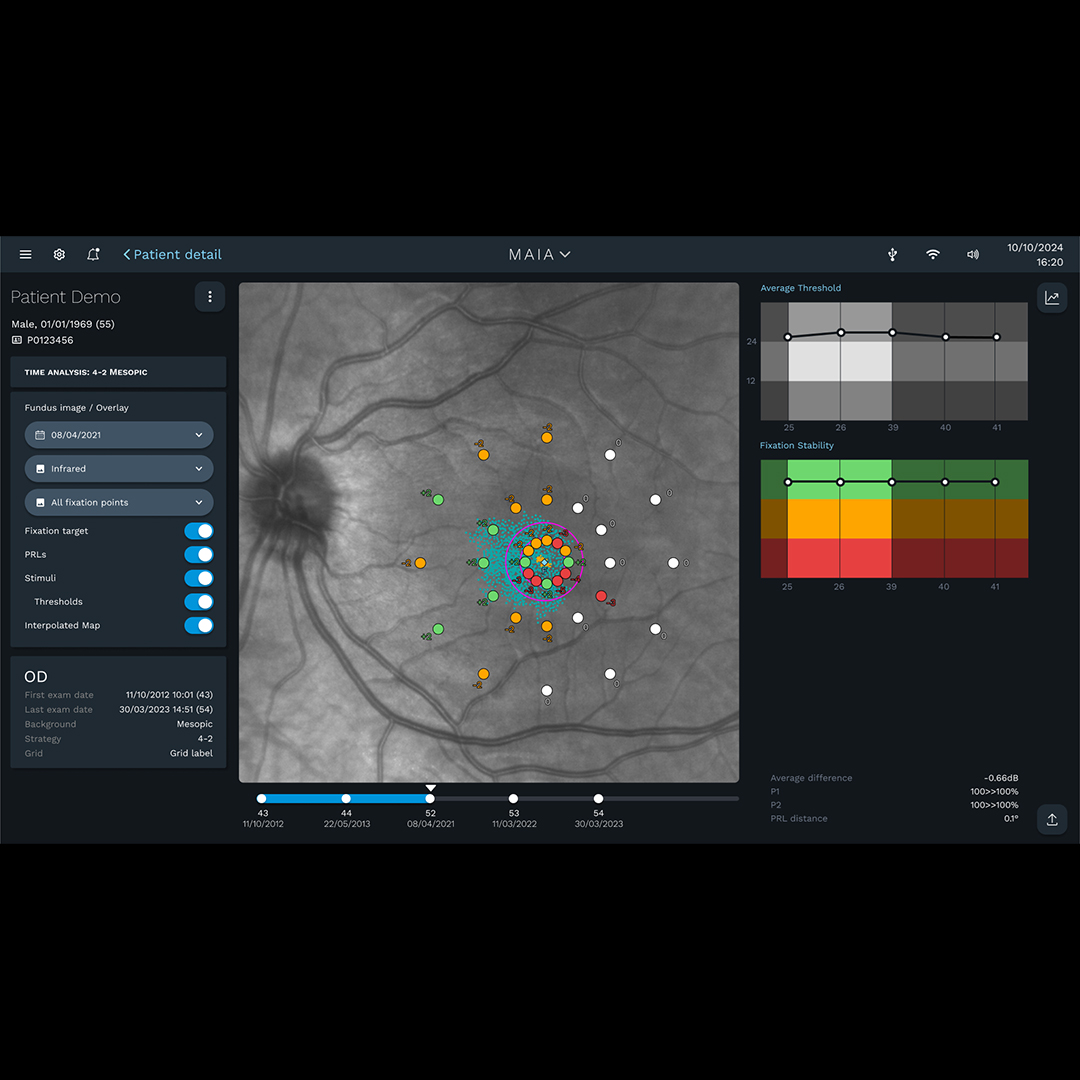
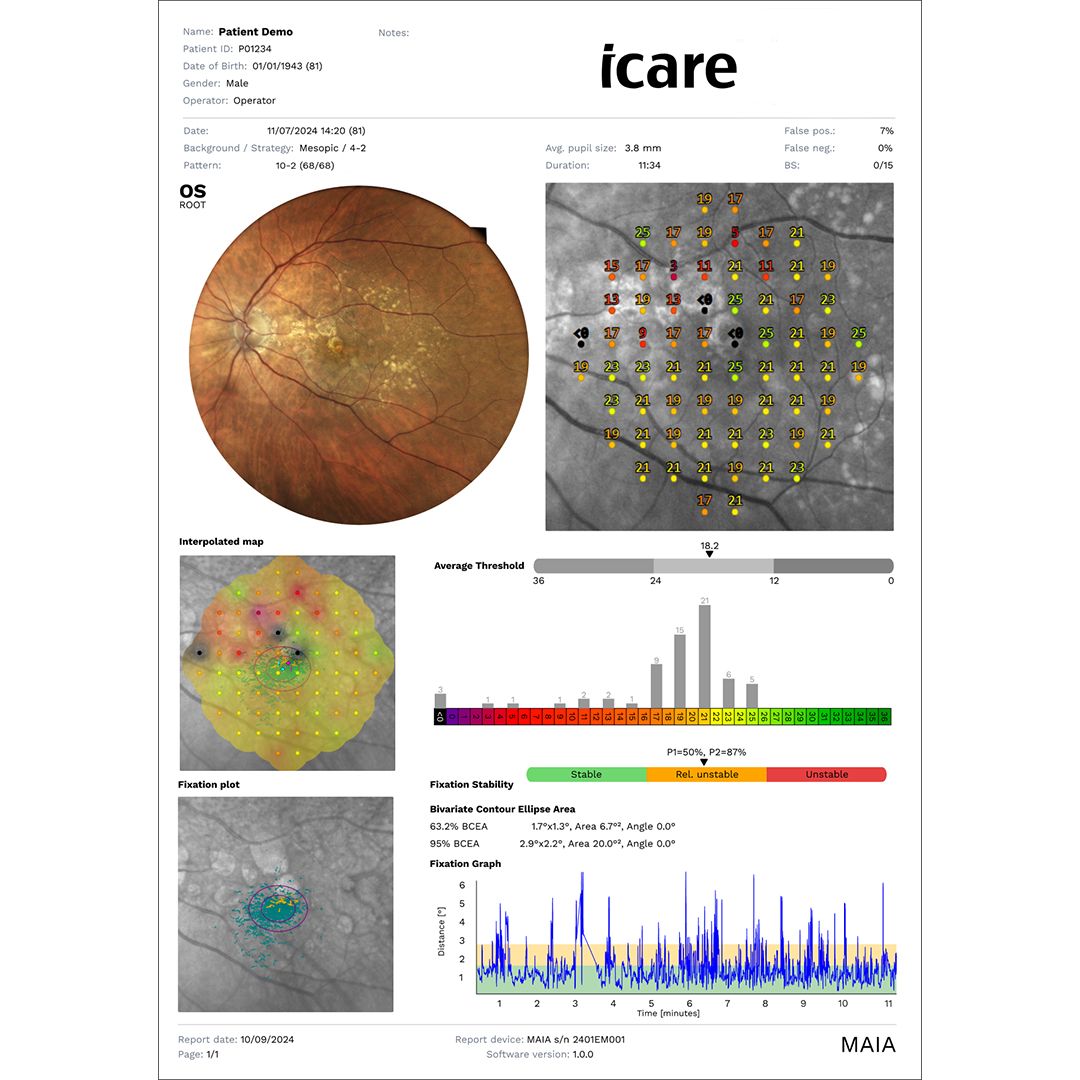
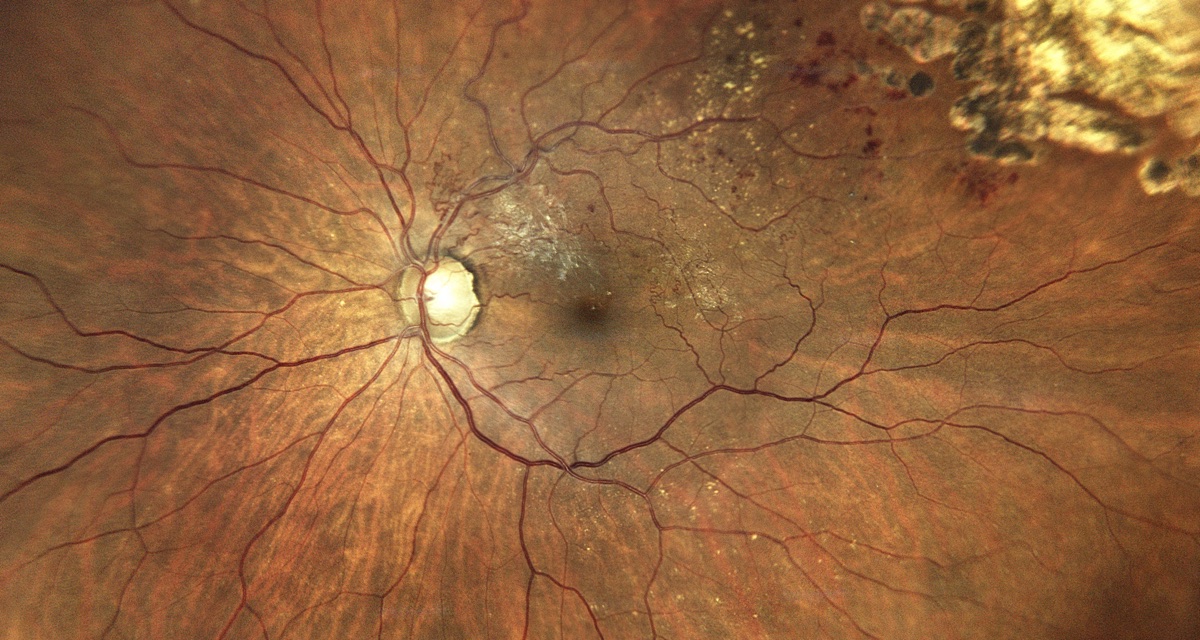
The iCare MAIA is a TrueColor microperimetry system that combines retinal sensitivity mapping, real-time fundus tracking at 25 Hz, and non-mydriatic confocal fundus imaging in a single automated exam. By measuring macular function point-by-point while simultaneously imaging the retina, the MAIA reveals the functional impact of macular disease that structural imaging alone cannot show — helping patients see the value in their retinal therapies and reducing treatment drop-off. With 60-degree TrueColor, infrared, red-free, blue, and red imaging modalities plus customizable microperimetry test grids, the MAIA gives retina and macular disease practices the structure-function correlation data they need for diagnosis, treatment monitoring, and patient engagement.
- Microperimetry with real-time retinal tracking at 25 Hz — compensates for fixation loss
- TrueColor confocal fundus imaging with 60° field of view (5 MP sensor)
- Non-mydriatic through pupils as small as 3 mm
- Multiple imaging modalities: TrueColor, infrared, red-free, blue, red
- Pre-programmed and customizable microperimetry test grids
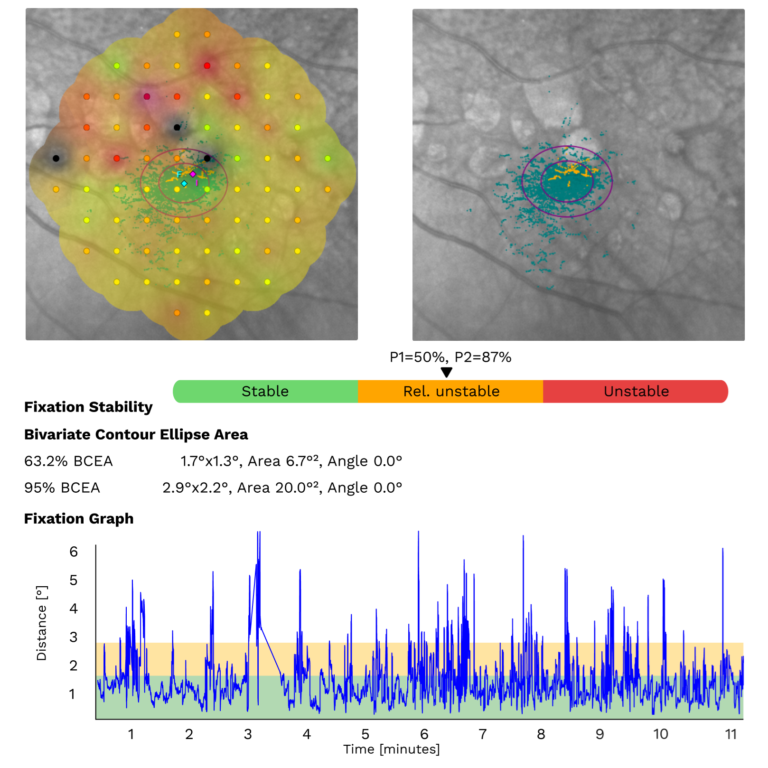
- Fixation stability and preferred retinal locus (PRL) analysis
- Full threshold (4-2) and suprathreshold testing strategies
- 15" multi-touch display with auto-alignment and auto-focus
- Automatic refraction correction (–12D to +15D)